Year 3 Mathematics
🧮 Year 3 Mathematics UASA Revision Notes (With Examples & Visuals)
1️⃣ Write the Number
Explanation: Read and write numbers in numerals and words. Practice numbers up to 10,000.
Example
Numeral: 827 → In words: eight hundred twenty-seven

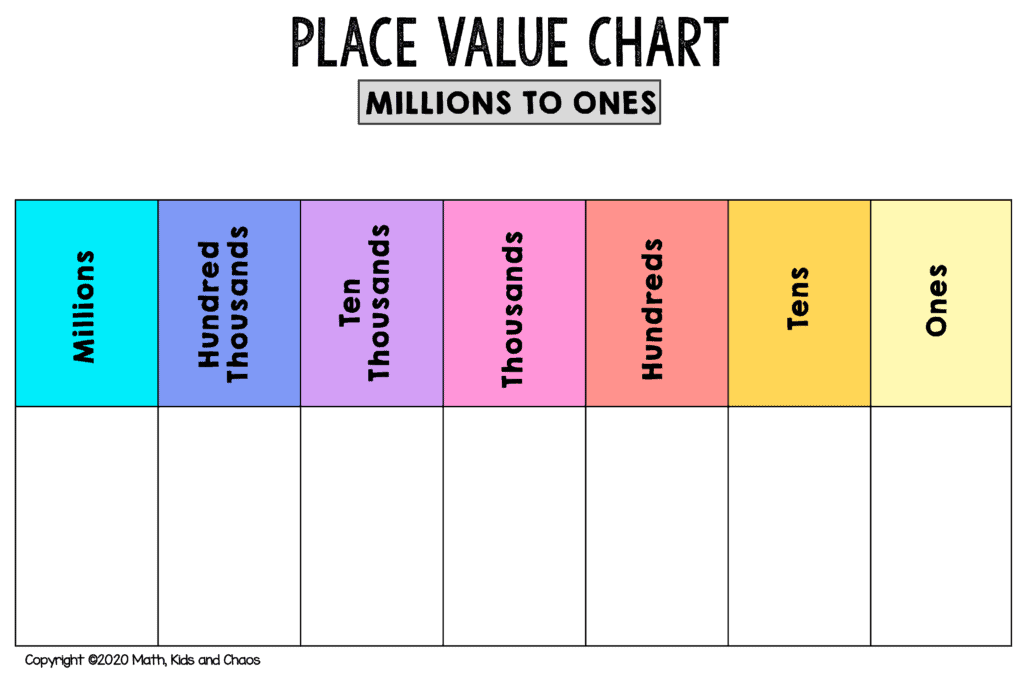
2️⃣ Digit Value / Place Value
Explanation: Each digit has a value depending on its place — ones, tens, hundreds, thousands.
Example
In 3,472: 3 = thousands (3,000), 4 = hundreds (400), 7 = tens (70), 2 = ones (2).
3️⃣ Partition (Number Expansion)
Explanation: Break numbers into place-value parts to understand structure and simplify calculations.
Example
4,253 = 4,000 + 200 + 50 + 3
4️⃣ Arrange the Numbers
Explanation: Order numbers in ascending (small → large) or descending (large → small) order.
Example
Ascending: 4,327, 4,372, 4,397
Descending: 890, 675, 432
5️⃣ Round Off
Explanation: Round to the nearest ten, hundred, or thousand.
Examples
- 67 → nearest ten = 70
- 843 → nearest hundred = 800
6️⃣ Addition
Explanation: Combine two or more numbers. Use column method for larger numbers.
Example
  324
+ 245
-----
  569
7️⃣ Subtraction
Explanation: Take away one number from another. Borrow when a top digit is smaller.
Example
  725
- 438
-----
  287
8️⃣ Multiplication
Explanation: Repeated addition. Learn times tables (1–12) and simple column multiplication.
Examples
- 4 × 3 = 12 (4 + 4 + 4)
- 23 × 4 = 92

9️⃣ Division
Explanation: Share into equal groups or find how many times one number fits into another.
Examples
- 12 ÷ 3 = 4
- 42 ÷ 6 = 7
🔟 Fraction
Explanation: A fraction represents a part of a whole. Numerator = parts taken, Denominator = total equal parts.
Examples
- ½ = one of two equal parts
- If 3 of 8 pizza slices are eaten → eaten = 3/8

🏁 Convert Units
Explanation: Convert between metric units: length, mass, volume and time.
Examples
- 100 cm = 1 m
- 1,000 g = 1 kg
- 60 minutes = 1 hour

🔷 Polygon
Explanation: A polygon is a closed figure with straight sides. Identify by number of sides.
Examples
- Triangle = 3 sides
- Square = 4 sides
- Pentagon = 5 sides
- Hexagon = 6 sides

📍 Location
Explanation: Use simple grid references or coordinates to show position (column, row).
Example
Point at (3, 2) → x = 3 (across), y = 2 (up). Read across first, then up.

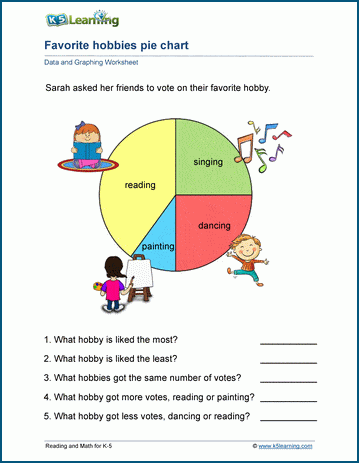
📊 Data (Pie Chart)
Explanation: A pie chart shows parts of a whole. Each slice is a fraction or percentage of the whole circle (360°).
Examples
If pie chart shows: Apples 50%, Bananas 25%, Grapes 25% — out of 100 students → Apples = 50 students.
🌟 Final Exam Tips
- Practice daily with the activity book.
- Show working steps clearly — examiners mark method.
- Focus on understanding place value and operations.
- Use visuals (charts, number lines, grids) while practising.
📚 References & Official Links
- Curriculum Specifications — Mathematics Year 3 (KSSR Semakan) — BPK / MOE
- Mathematics DLP Year 3 — Part 1 (Digital Textbook example)
- AnyFlip / sample syllabus materials (search for KSSR Year 3 Mathematics)
© Ready for Blogger — English only. If you want the HTML adjusted (different images, more exercises per topic, printable worksheets links), tell me which topics to expand and I will update the code.

Comments
Post a Comment